Numbers don’t lie. In fact, they can tell a compelling story when harnessed with purpose.
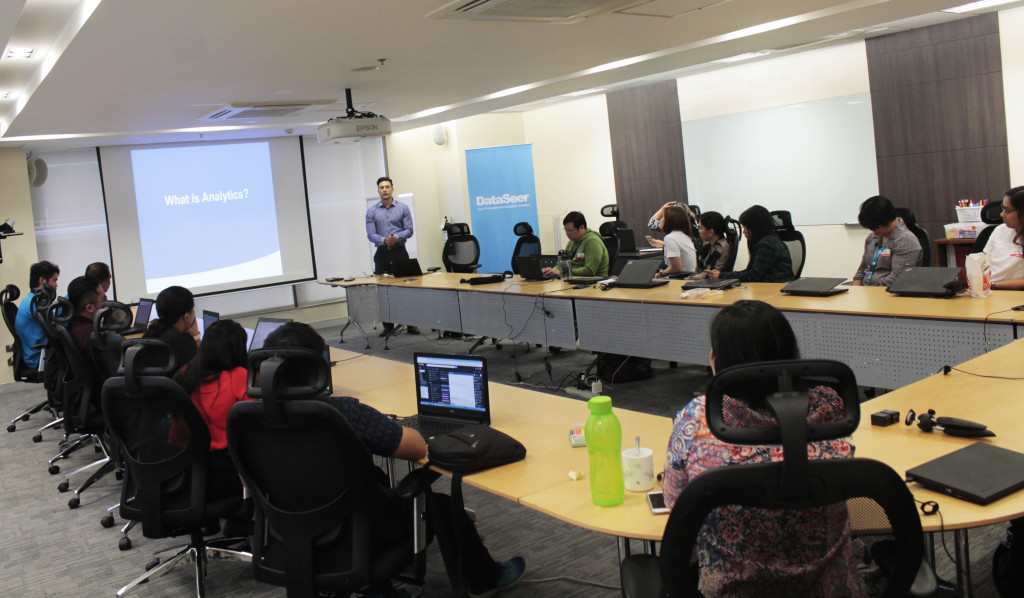
This is the learning that was imparted to Aboitiz team members after participating in the analytics and reporting workshop organized by the Human Resources Team of Aboitiz Equity Ventures, Inc. (AEV) last April 21 at NAC Tower, BGC, Taguig City.
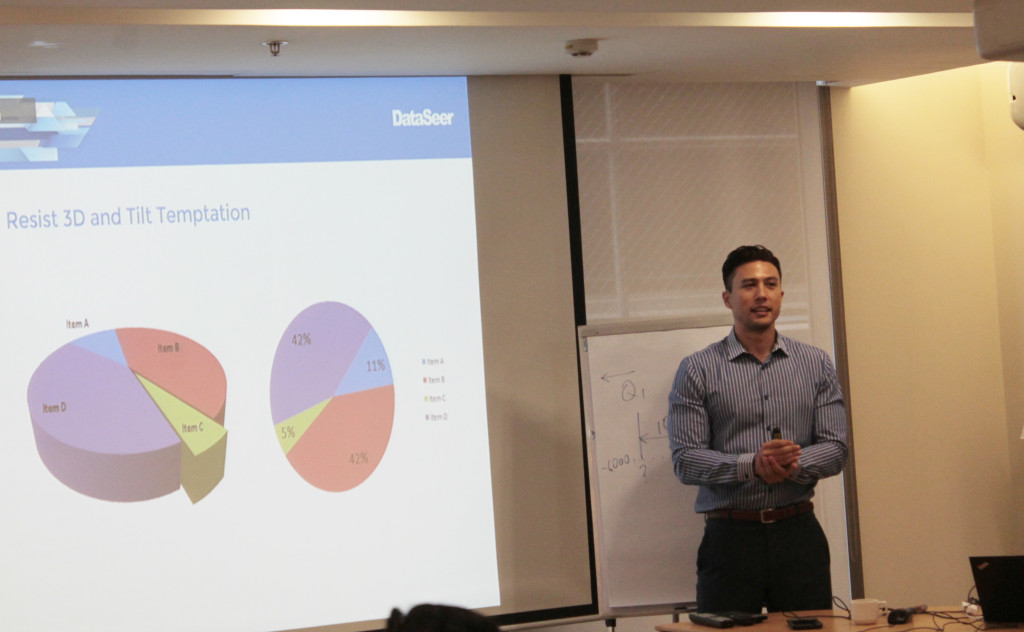
The event’s speaker, Data Seer’s Founder and Lead Data Science Trainer Isaac Reyes, discussed the analytics value chain and the purpose each component of the chain serve in the context of human resources and organizational decision-making.
“It’s all about asking the right questions and telling the rights stories to make the right decisions.”
-Isaac Reyes, Founder and Lead Data Science Trainer, Data Seer
The whole-day session was divided into five parts: an overview of people analytics and the analytics value chain, the art of storytelling with people data, a case study walkthough involving predictive analytics, actionable people analytics data story and a workshop activity.
Key takeaways:
- Data cascade has two major forms: explanation of data and exploration of data. While the first form is not interactive and direct, the second, interactive one lets people do analyses themselves.
- Different types of data can be used for different types of charts, and for various purposes. It depends on the end-users of that data which metrics should an analyst use.
- As much as numbers are important in presenting findings, design should also be incorporated in data reporting. One needs to adjust the collaterals used in order to effectively convey the right message and put the correct emphasis.
- There are about six steps in a typical predictive analytics and its corresponding data consumption process: identifying the problem, choosing the correct method, preparing the data, identifying significant predictors, analyzing the data and correcting false assumptions.
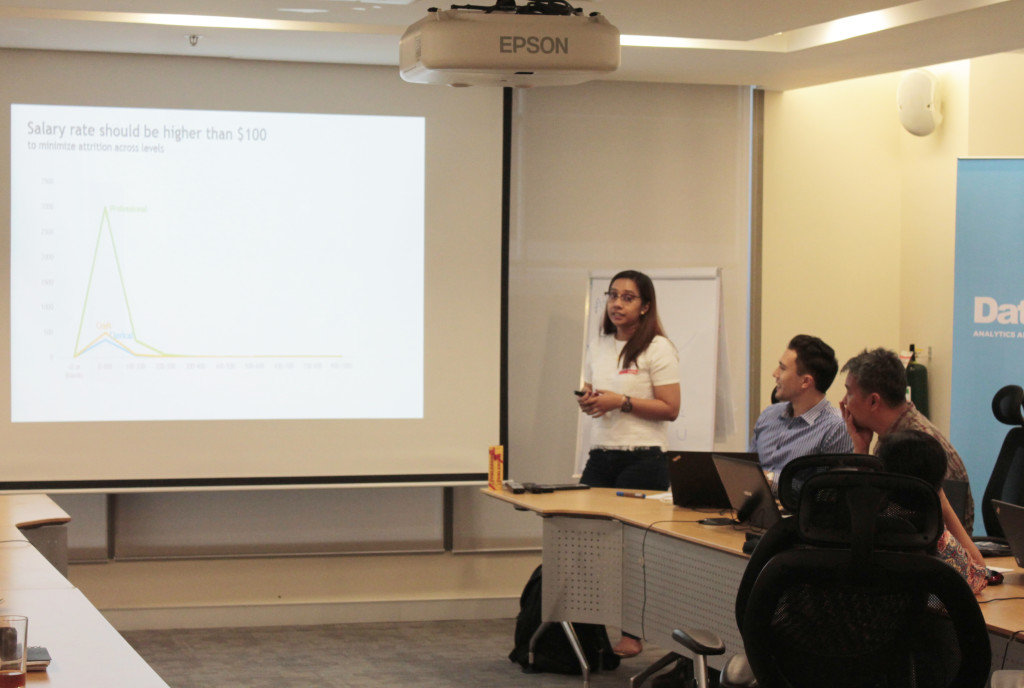
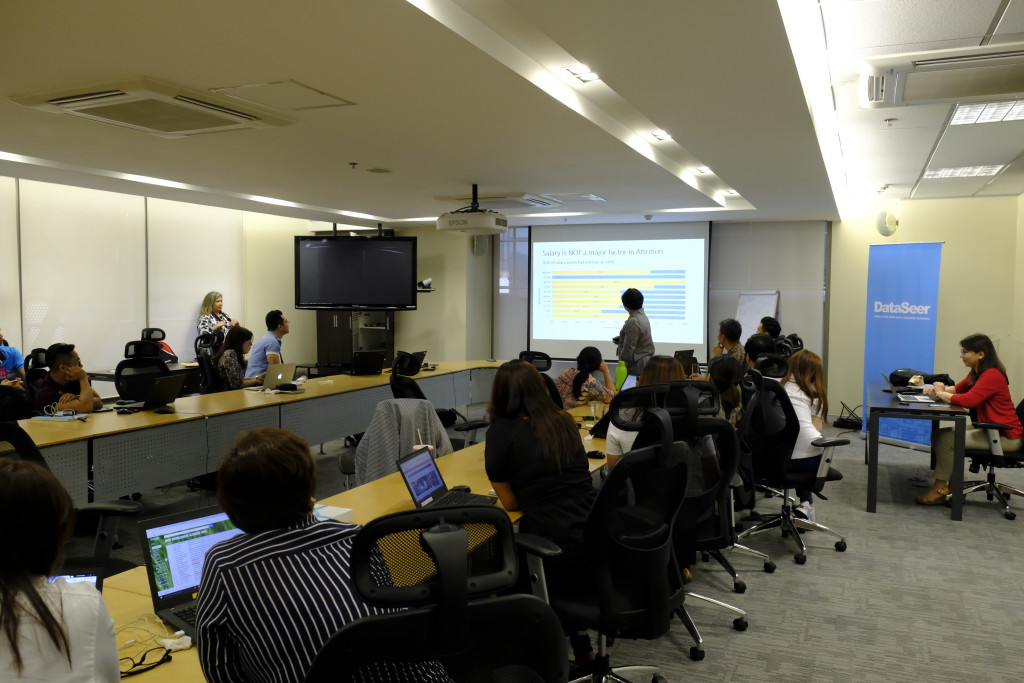
Towards the end of the workshop, participants were asked to come up with their own analysis using raw data, which they then presented in a mock executive pitch.
“It was surprising to see how making a few simple changes in the default excel graphs can make a big impact in making your data easier to understand. I will certainly keep these in mind when preparing for my presentations in future.”
-Richmond Dy, Talent Analytics Officer, AEV HR
“This workshop gives you a foundation in data management and analysis. I’m happy to get practical tips and techniques I can apply to my work right away.”
-Xandra Galang, Learning and Development Manager, Aboitiz Group